Estimating the IQ of Richard Feynman
Richard Feynman claims that his IQ is 125, though privately Emil Kirkegaard has expressed skepticism at this number - Feynman is known for being a troll and he also achieved unprecendented scores in the physics and math portions on the entrance exams for Princeton. However, he did notably underperform on the history and english sections - hinting that maybe the issue is ability tilt.
Apparently his sister also saw the score and said he lied, and that he scored a 123, 1 point below her. This actually makes me think they are both lying, since it would be an odd thing to do in a context that isn’t already trolly. Overall, I think P(lying) is about 0.5 - possible, but could also be explained by randomness Nevertheless, I’ll make one estimate assuming he lied and another assuming he didn’t, then weigh them according to my beliefs.
Here are his z-scores:
He scored 1st on the Putnam competition out of 3000 by a longshot. It’s difficult to determine what this would be in z-score terminology. A conservative estimate would be 3.4 (mean=100) and a liberal one would be 4.4 (mean=115). Averaging them out gives 3.9 - which I will use as a minimum rather than a concrete estimate.
(PhD, 1942) eduttainment z-score of 2.2 according to jensen method + eduyears spreadsheet
According to his biography, these were his results on the entrance exam:
“Slater and Morse communicated directly with their colleagues at Princeton in January 1939, signaling that Feynman was something special. One said his record was “practically perfect,” the other that he had been “the best undergraduate student we have had in the Physics Department for five years at least.” At Princeton, when Feynman’s name came up in the deliberations of the graduate admissions committee, the phrase “diamond in the rough” kept materializing out of the wash of conversation. The committee had seen its share of one-sided applicants but had never before admitted a student with such low scores in history and English on the Graduate Record Examination. Feynman’s history score was in the bottom fifth, his literature score in the bottom sixth; and 93 percent of those who took the test had given better answers about fine arts (who cares about that though). His physics and mathematics scores were the best the committee had seen. In fact the physics score was perfect.”
The history score would translate to a z-score of -0.84 and the english one would translate to a z-score -0.96. I personally think he just didn’t give a fuck - discrepancies of this magnitude are essentially impossible in non-savants. In fact, if I put these values into the simulation, I probably wont find anybody matching these values. Averaging out the z-scores produces an estimate of 1.9 - which is an obvious underestimate, as the average of the z-scores is always going to be less extreme than the general estimate.
So do you know what? I’m just going to ignore the GRE results. They are way too difficult to model, and I don’t have a reference distribution for the scores that matter.
Currently assuming the test used for the putnam prize correlates with IQ at 0.7, that eduttainment and IQ correlate at 0.55, and that the IQ test he took has a reliability of 0.9.
The simulation that ignores the IQ score yields an estimate of 147 and a standard error of 9.6.
The one that doesn’t yields an estimate of 133 and SE of 5.7
Combining the two estimates yields a mean of 139 and SE of 9.9.
The math-specific estimate is 153 (3.9*0.9*15+100)
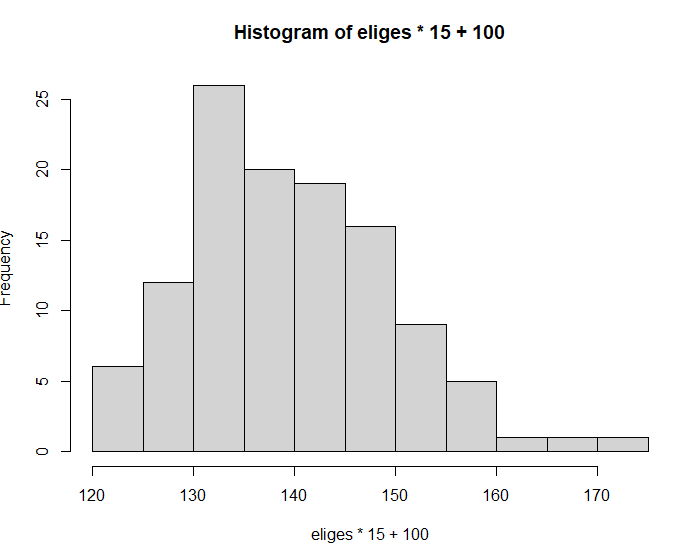
This is the histogram of the individuals identified as potential feynman’s, coming from equal numbers of both methods of calculating the estimate (including or excluding the IQ test)
set.seed(5)
g <- rnorm(60000000)
iq <- 0.9*g + rnorm(60000000)*sqrt(1-0.9^2)
c1 <- 0.7*g + rnorm(60000000)*sqrt(1-0.7^2)
bs <- 0.55*g + rnorm(60000000)*sqrt(1-0.55^2)

subby1 <- data.frame(iq, c1)
subby1$g = g
subby1$bs = bs

subby2 <- subset(subby1, (subby1$c1 > 3.9) & (subby1$bs > 2.14 & subby1$bs < 2.34) & (subby1$iq > 1.5 & subby1$iq < 1.8))
mean(subby2$g)
sd(subby2$g)

#eliges <- subby2$g
eliges <- append(eliges, subby2$g)
mean(eliges)
sd(eliges)

subby2 <- subset(subby1, (subby1$c1 > 3.9) & (subby1$bs > 2.14 & subby1$bs < 2.34))
mean(subby2$g)
sd(subby2$g)

eliges <- append(eliges, subby2$g[1:58])
mean(eliges)
sd(eliges)
mean(eliges[1:58])
sd(eliges[1:58])

hist(eliges*15+100)


